P3D5: Visualizing Space and Time
Semester Schedule
Coding challenge and semester deliverables
- Semester deliverables
- First coding challenge discussion
- Final coding challenge discussion
Let’s pick a being reading for Wednesday
A time and space example
Packages and data
library(tidyverse)
library(sf)
library(USAboundaries)
library(leaflet)
library(geofacet)

httpgd::hgd()
httpgd::hgd_browse()

dat <- read_rds("chipotle_nested.rds") %>%
    st_as_sf(coords = c("longitude", "latitude"), crs = 4326)

states <- us_states() %>%
    filter(!state_name %in% c("Alaska", "Hawaii", "Puerto Rico")) %>%
    st_transform(4326)
Build plotting data
Spatial
dat_space <- dat %>%
    select(placekey, street_address, city, stusps = region, raw_visitor_counts) %>%
    filter(!is.na(raw_visitor_counts)) %>%
    group_by(stusps) %>%
    summarise(
        total_visitors = sum(raw_visitor_counts, na.rm = TRUE),
        per_store = mean(raw_visitor_counts, na.rm = TRUE),
        n_stores = n(),
        across(geometry, ~ sf::st_combine(.)),
    ) %>%
    rename(locations = geometry) %>%
    as_tibble()

states <- states %>%
    left_join(dat_space)
Temporal
dat_time <- dat %>%
    as_tibble() %>%
    select(placekey, street_address, city, region, raw_visitor_counts, visits_by_day) %>%
    filter(!is.na(raw_visitor_counts)) %>%
    unnest(visits_by_day) %>%
    rename(dayMonth = name, dayCount = value) %>%
    group_by(region, dayMonth) %>%
    summarize(
        dayAverage = mean(dayCount),
        dayCount = sum(dayCount),
        stores = length(unique(placekey))) %>%
    mutate(
        stores_label = c(stores[1], rep(NA, length(stores) - 1))
    )
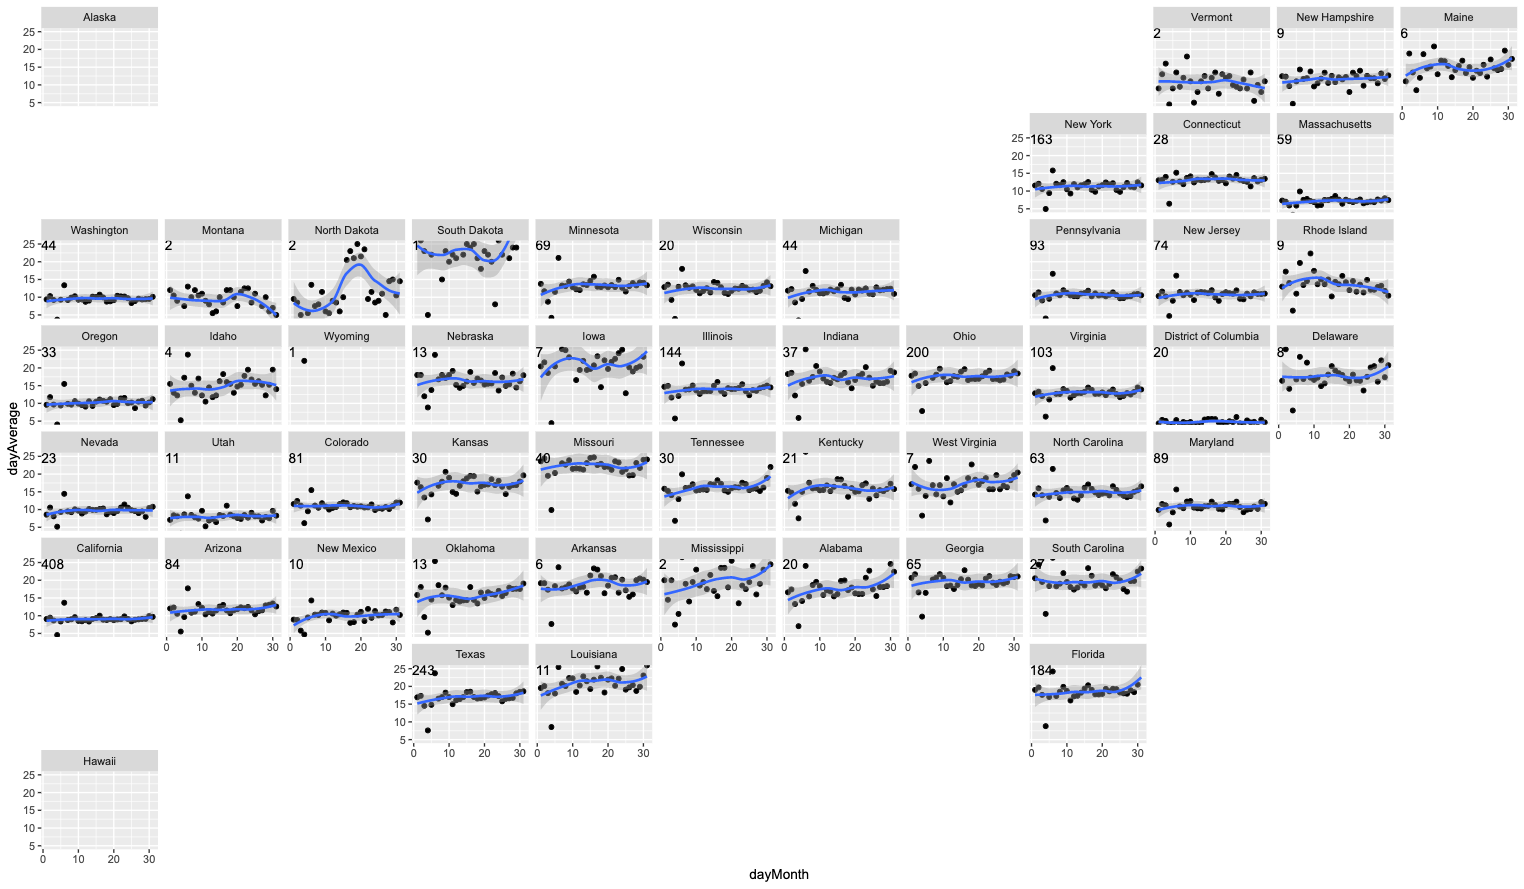
Plots with geofacet
dat_time %>%
    ggplot(aes(x = dayMonth, y = dayAverage)) +
    geom_point() +
    geom_smooth() +
    geom_text(
        aes(label = stores_label),
            x = -Inf, y = Inf,
            hjust = "left", vjust = "top") +
    facet_geo(~region, grid = "us_state_grid2", label = "name")

dat_time %>%
    ggplot(aes(x = dayMonth, y = dayAverage)) +
    geom_point() +
    geom_smooth() +
    geom_text(aes(label = stores_label),
        x = -Inf, y = Inf,
        hjust = "left", vjust = "top") +
    coord_cartesian(ylim = c(5, 25)) +
    facet_geo(~region, grid = "us_state_grid2", label = "name")