P1D6: Open programming time for Python
First principles weighted mean
- Let’s talk about lambda functions
- Why we want to use them with
df.assign() - Working through a groupby
Plotnine’s port of ggplot2
What are the key differences you have noted between ggplot2 and plotnine?
- Quoting table columns
.save()method versus theggsave()function.
Questions about Altair
alt.Chart()and the introductionalt.X()alt.Y()alt.Scale()alt.Axis()alt.Size()alt.Column()alt.layer()alt.Chart()methods
alt.Chart() and the introduction
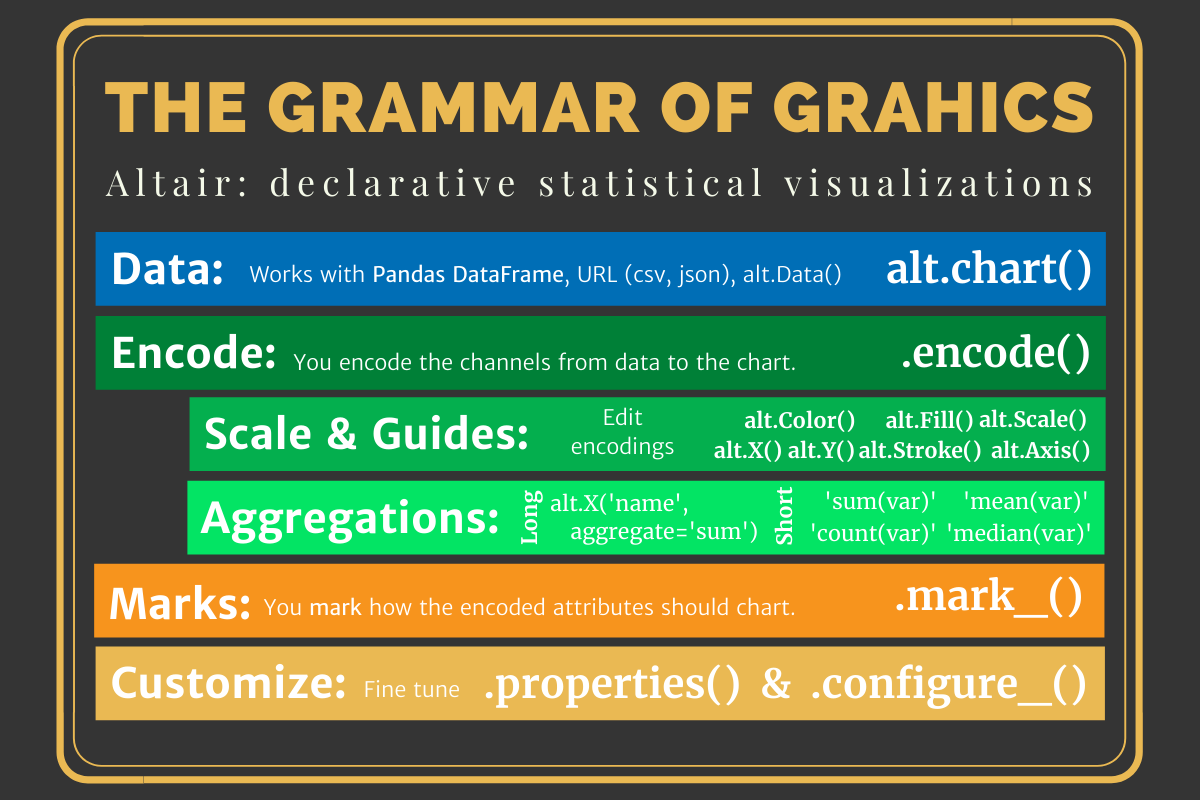
Note that Altair defaults to placing commas at the thousands. We can fix that with alt.Axis(format='.0f')
You can only use one data object
You can’t facet with multiple data sets. So, we need to get our continent data into our country DataFrame.
- I create a new
continent_colorcolumn. - Make sure the columns are identically named.
- In
cont_facetI create acountrycolumn with'Continent'repeated. This will help in thedetailargument of.mark_line(). - In
cont_facetthen create a"Continent"value in thecontinent_colorcolumn. This will allow me to mark it on the legend as the continent average in black. - Then we leverage the
.append()method from Pandas.
count_facet = (gapminder
    .filter(['country', 'continent', 'year',
    'pop', 'gdpPercap', 'pop100k'], axis=1)
    .assign(continent_color = lambda x: x.continent)
)
cont_facet = (gm_con
    .filter(['continent', 'year', 'sum_pop',
        'gdpPercap', 'pop100k'], axis=1)
    .rename({'sum_pop':'pop'},
        axis='columns')
    .assign(
        country = "Continent",
        continent_color = "Continent"
         )
)

dat_facet = count_facet.append(cont_facet)